01 · Market overview: the world's blueberry capital.
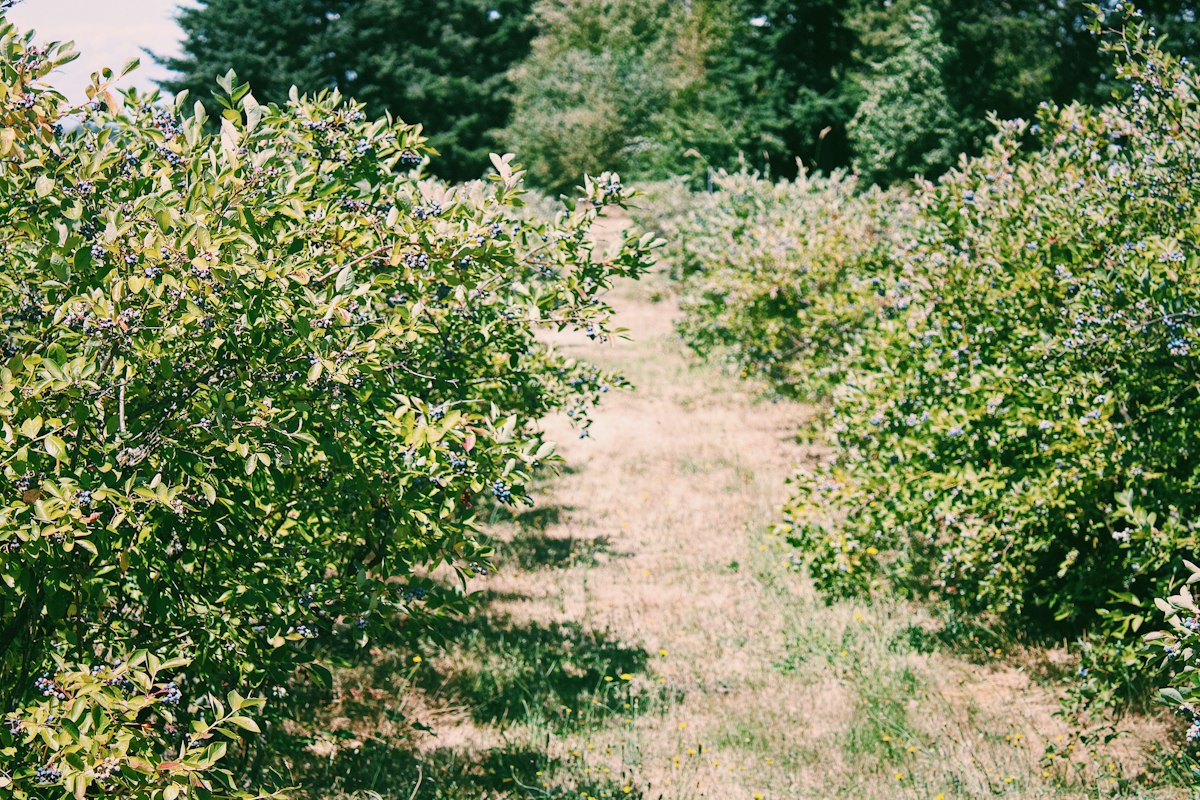
Peru is the world's largest exporter of fresh blueberries, with shipments valued at US$ 2.27 billion in the 2024-25 campaign.[1] The industry has grown from near zero in 2012 to more than 250,000 tonnes shipped a year, making it one of the fastest agricultural export build-outs in Latin American history. Total blueberry production reached between 254,000 and 373,000 tonnes per year by the 2024-25 season, depending on the source and whether domestic consumption is included.[1][2]
| Campaign | Export value | Volume (approx.) | Source |
|---|---|---|---|
| 2015-16 | US$ 233 M | ~28,000 t | ADEX / SUNAT |
| 2016-17 | US$ 370 M | ~52,000 t | ADEX / SUNAT |
| 2017-18 | US$ 589 M | ~82,000 t | ADEX / SUNAT |
| 2018-19 | US$ 821 M | ~119,000 t | ADEX / SUNAT |
| 2019-20 | US$ 1,010 M | ~155,000 t | ADEX / SUNAT |
| 2020-21 | US$ 1,110 M | ~180,000 t | ADEX / SUNAT |
| 2021-22 | US$ 1,350 M | ~220,000 t | ADEX / SUNAT |
| 2022-23 | US$ 1,680 M | ~250,000 t | ADEX / SUNAT |
| 2023-24 | US$ 1,950 M | ~285,000 t | ADEX / SUNAT |
| 2024-25 | US$ 2,270 M | ~310,000 t | ADEX / SUNAT |
Export volumes are approximate and vary by source. Campaign years run roughly August to March. Domestic consumption is excluded.
Why substrate is mandatory
Peru's blueberry farms are concentrated on the coastal desert strip between the Andes and the Pacific. The soils there are alkaline, pH 7.5–8.5, with high salinity and poor organic matter.[3] Blueberries (Vaccinium corymbosum) require acidic conditions, pH 4.5–5.5, for root uptake of iron and other micronutrients. Growing blueberries in native Peruvian soil without substrate amendment produces yields of only 6–10 tonnes per hectare, versus 20 tonnes per hectare in coir-substrate pot systems, a 2–3x multiplier.[4]
As a result, about 80 % of new 2026 plantings are hydroponic, meaning the plant sits in a pot or bag of coir substrate rather than in the ground.[5] Of Peru's 20,195 hectares of certified blueberry area, approximately 3,400 ha (19 %) are already in substrate pots, and the remaining 81 % of existing area is still available for soil-to-substrate conversion as farms chase the yield premium.[5][6]
02 · Import volumes and supply origins.
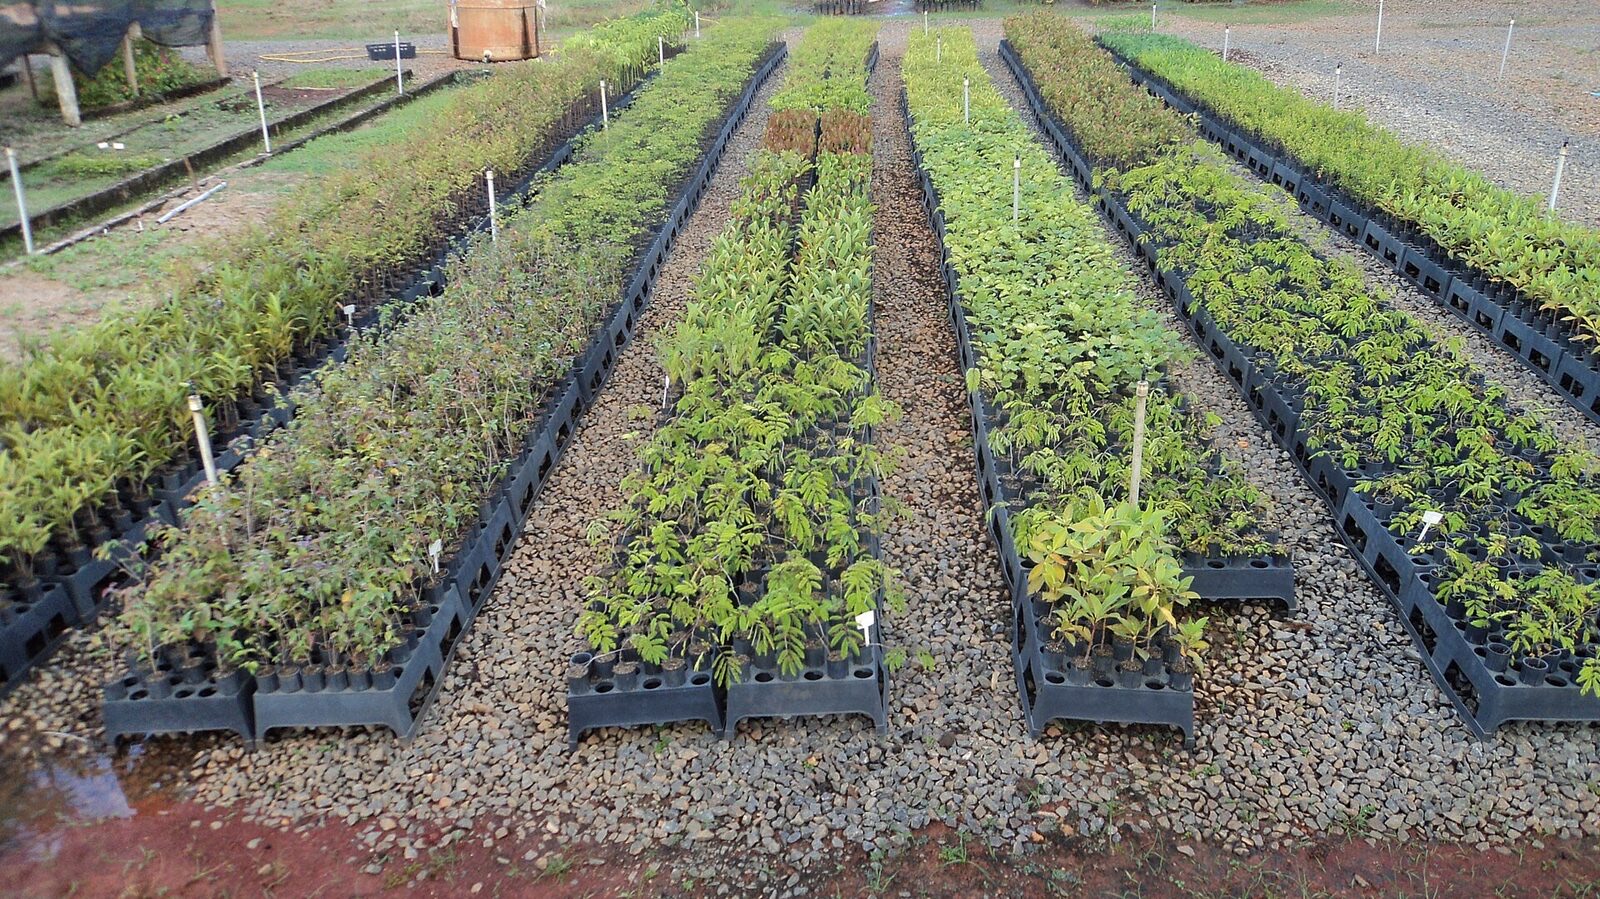
Volza shipment tracking records approximately 573 coir-related shipments to Peru as of September 2026, distributed across several product categories.[8]
| Category | Shipments tracked | Share | Source |
|---|---|---|---|
| Coco Peat | 364 | 63.5 % | Volza, Sep 2026 |
| Coir Pith | 128 | 22.3 % | Volza, Sep 2026 |
| Coconut Fibre | 74 | 12.9 % | Volza, Sep 2026 |
| Coir Fibres | 7 | 1.2 % | Volza, Sep 2026 |
| Total | ~573 | 100 % | Volza, Sep 2026 |
Shipment counts are not tonnages. Categories overlap (coco peat and coir pith are the same product under different trade names). About 85 %+ of imports are pith/peat by mass.
At 20–23 tonnes per container (40' HC with 5 kg blocks), this implies an estimated annual import volume of roughly 11,460–13,179 tonnes.[8] Coir import growth was +69 % year on year in the March 2023 to February 2024 period.[8]
| Origin | Estimated share | Notes | Source |
|---|---|---|---|
| India | ~85–90 % | Dominant supplier; several large coir exporters have local agents or subsidiaries in Lima | Volza, Sep 2026 |
| Sri Lanka | ~5–10 % | Second origin; some premium buffered product | Volza, Sep 2026 |
| Netherlands | ~2–5 % | Re-export of Indian/Sri Lankan pith processed in NL | Volza, Sep 2026 |
| Israel / Spain | < 2 % | Substrate companies with operations in Peru | Industry reporting |
| Brazil | 0 % | No current supply. Opportunity. | Volza, Sep 2026 |
Origin shares are estimates based on Volza shipment records and industry reporting. India's dominance reflects its position as the world's largest coir pith exporter (59.6 % of US$ 434 M in FY 2024-25).
03 · Key segments: blueberries dominate.
Blueberries
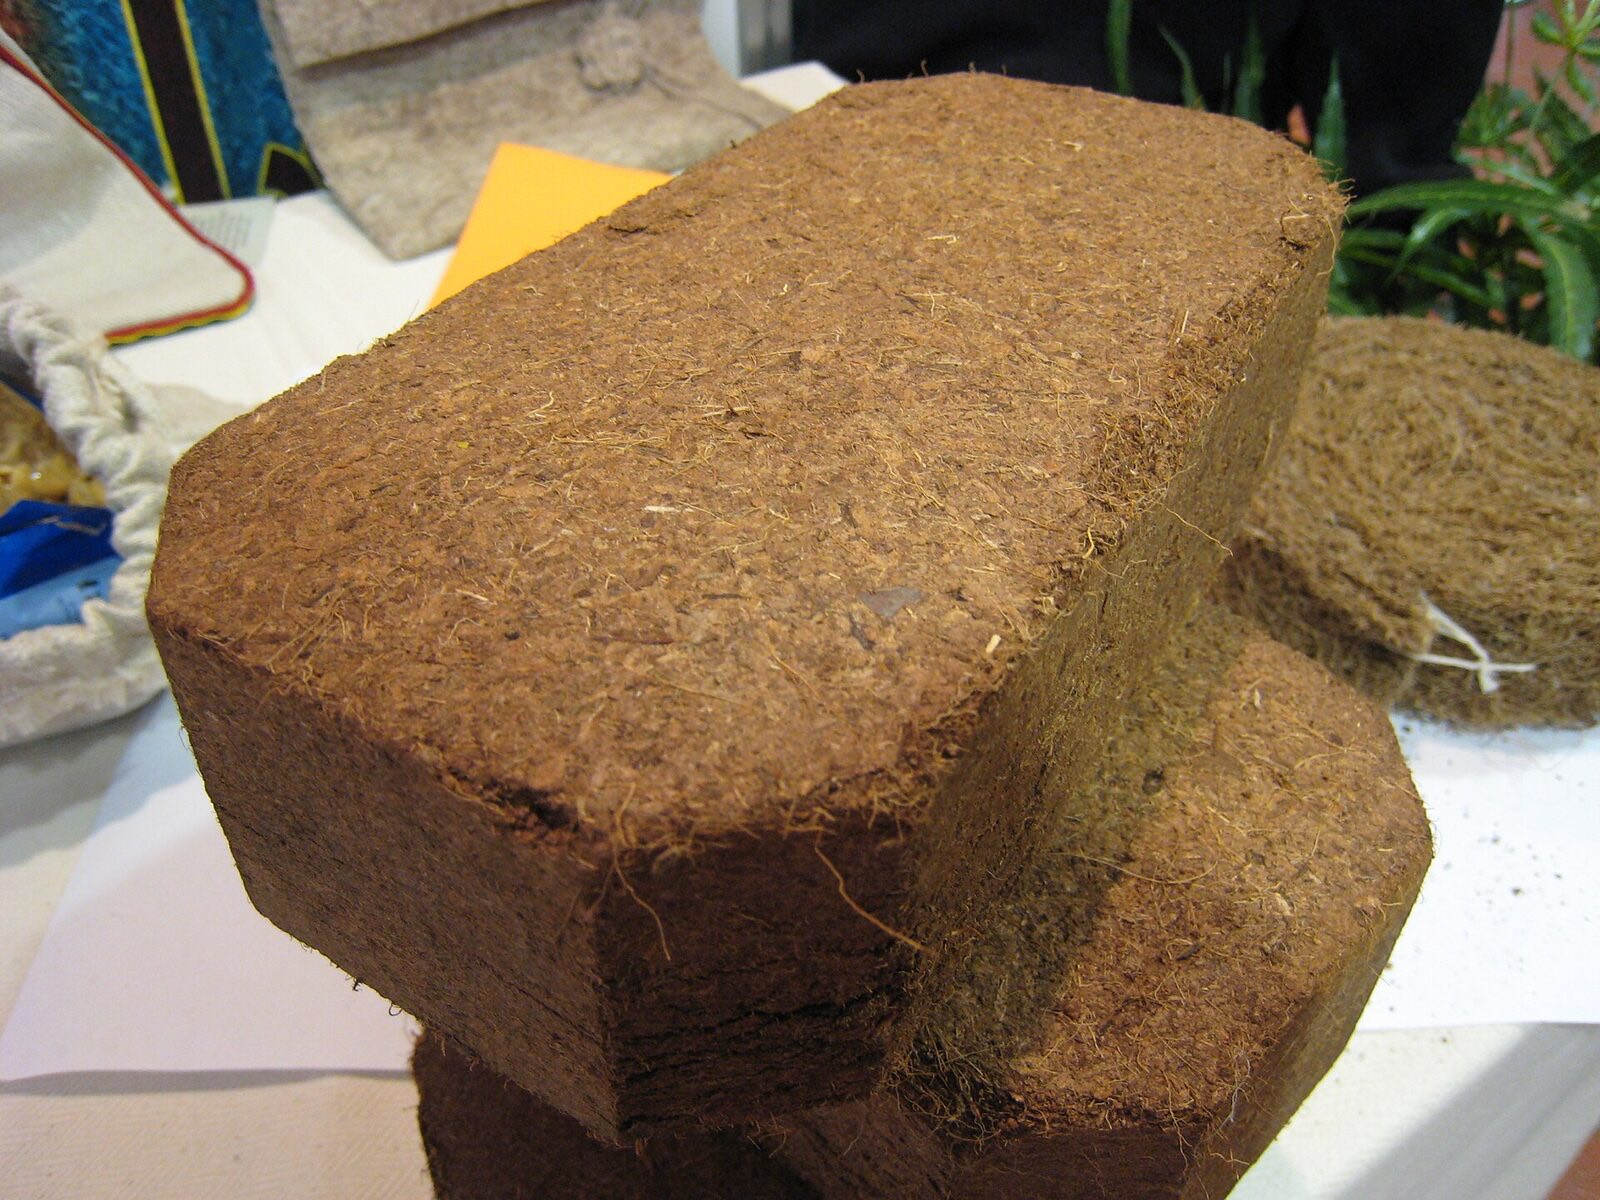
The blueberry sector is the overwhelming driver of Peru's coir demand. With 20,195 hectares of certified area, US$ 2.27 billion in exports, and a trajectory of 80 % hydroponic adoption for new plantings, blueberries alone could consume 40,000–60,000 tonnes of coir substrate per year at full conversion.[1][5][6] Current imports of ~12,000 tonnes represent only the early phase of this transition.
Peru's blueberry sector is dominated by a small number of large agro-export companies, many of which operate thousands of hectares. The largest produce avocados, table grapes and asparagus alongside blueberries, so a single buyer relationship can open multiple crop segments.
Avocado
Peru is a top-5 global avocado exporter, with about US$ 1 billion in annual exports.[9] Avocado nurseries use coir pith for rootstock propagation in tubetes and small pots. While the volume per hectare is much smaller than for blueberry substrate, the nursery segment is high-value and quality-sensitive, requiring low-EC buffered pith.
Table grapes and asparagus
Peru's Ica region produces table grapes and asparagus for export, both under extremely arid conditions (< 10 mm annual rainfall in parts of Ica).[10] Table grape nurseries and some asparagus operations use coir as a growing medium or soil amendment. These crops represent incremental demand rather than a primary driver, but they are often grown by the same companies that grow blueberries, meaning procurement is bundled across crops.
04 · Regional breakdown: where coir goes in Peru.
La Libertad: the blueberry heartland
The Viru, Chao and Trujillo valleys in La Libertad department are the epicentre of Peru's blueberry production. The region hosts the largest concentration of blueberry farms, benefiting from stable temperatures (16–24 C year-round), low humidity and proximity to the port of Salaverry.[6] Most of Peru's largest agro-exporters have their biggest blueberry operations here. This is where the highest volume of coir substrate is consumed.
Ica: arid, diversified, expanding
Ica is Peru's second-largest blueberry region and also the centre of table grape and asparagus production. Rainfall is below 10 mm per year in parts of the department, making irrigated agriculture the only option and substrate cultivation a natural fit.[10] The region is closer to Lima and the port of Callao than La Libertad, which simplifies last-mile logistics for imported substrate.
Lambayeque and Piura: the northern expansion frontier
New blueberry plantings are expanding northward into Lambayeque and Piura, supported by the Olmos irrigation project, which diverted Andean water to the coastal desert and opened 43,500 hectares of new irrigable land.[11] This is the growth frontier for both blueberry area and, consequently, for coir substrate demand. Land costs are lower than in La Libertad, and the climate is warm enough for year-round production.
05 · Logistics: Brazil's strongest freight corridor.
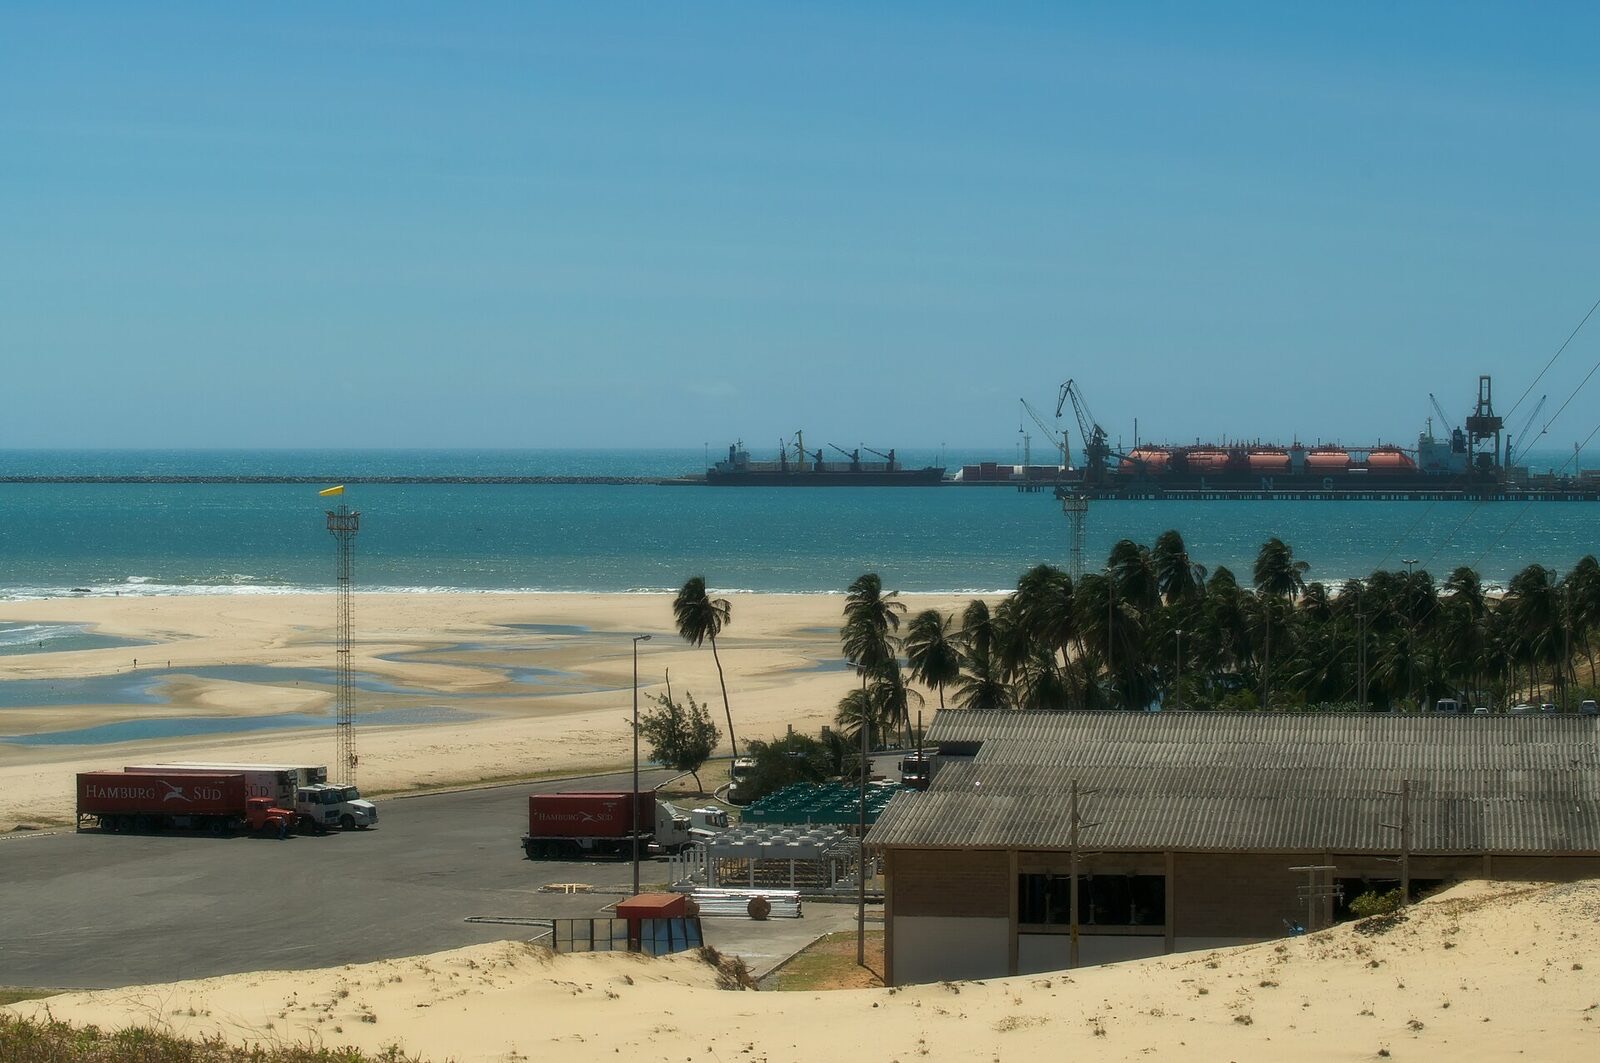
The freight advantage from Brazil to Peru is the single most compelling argument for supply-chain diversification. A container from Pecem (Ceara, Brazil) to Callao (Lima, Peru) sails northward through the Panama Canal, a distance of approximately 6,000 nautical miles, in 10–14 days.[12] This is 21–31 days shorter than the route from India, which crosses the Indian Ocean, rounds the Cape of Good Hope or transits the Suez Canal, and then crosses the Atlantic and Pacific.
| Origin | Transit to Callao | Estimated freight (US$/t) | Route | Source |
|---|---|---|---|---|
| Brazil (Pecem) | 10–14 days | $44–81 | Northward via Panama Canal, ~6,000 nm | Shipping line schedules |
| India (Tuticorin/Chennai) | 35–45 days | $180–250 | Indian Ocean, Cape of Good Hope or Suez, Atlantic, Panama Canal | Industry estimates |
| Sri Lanka (Colombo) | 30–40 days | $160–220 | Indian Ocean, Cape/Suez, Atlantic, Panama Canal | Industry estimates |
| Netherlands (Rotterdam) | 20–28 days | $120–180 | North Atlantic, Panama Canal | Industry estimates |
Freight rates are indicative ranges for 40' HC containers of compressed coco peat blocks at 20-23 t/container. Rates fluctuate with fuel surcharges, seasonal demand and carrier capacity. Brazilian rates reflect shorter distance and direct routing.
Route details
The Pecem–Callao route sails north along the Brazilian coast, through the Caribbean, and transits the Panama Canal before heading south along the Pacific coast of South America. The route avoids the Suez Canal and Red Sea entirely, eliminating the geopolitical risk that has disrupted Asia–Europe shipping since late 2023 and added 10–14 days to Indian and Sri Lankan transit times to many destinations.[12]
Trade agreement advantage
Brazil and Peru are members of the ACE 58 (ALADI Economic Complementation Agreement 58), which provides preferential tariff treatment for goods of qualifying origin. Under ACE 58, coir products from Brazil are likely to enter Peru at 0 % import duty, versus the 0–6 % MFN (most favoured nation) tariff applied to imports from India and other non-ALADI origins.[13] The duty saving alone can offset part of any FOB price differential.
Speed advantage: why 21–31 fewer transit days matter
Beyond the direct freight saving, shorter transit means:
Lower inventory carrying cost. A Peruvian grower can order from Brazil and receive product in two weeks instead of six, reducing the working capital tied up in transit and the need for large safety stocks.
Faster response to demand. If a grower expands area mid-season or needs to replace degraded substrate, Brazil can deliver a spot order in the time it takes an Indian shipment to clear the Indian Ocean.
Less spoilage and moisture risk. Compressed coco peat is stable, but 35–45 days at sea in tropical humidity can raise moisture levels; a shorter voyage reduces this risk.
06 · Pricing: near-parity, speed premium.
CIF Callao benchmarks
| Item | India (washed pith) | Brazil / Carve (washed pith) | Source |
|---|---|---|---|
| FOB port of loading | US$ 350–400 /t | US$ 550–600 /t | Industry, Sep 2026 |
| Ocean freight | $180–250 /t | $44–81 /t | Shipping line schedules |
| Import duty (est.) | 0–6 % MFN | ~0 % (ACE 58) | ALADI / SUNAT tariff |
| Port handling + inland | $40–60 /t | $40–60 /t | Industry estimates |
| Estimated CIF Callao | ~US$ 615 /t | ~US$ 678–730 /t | Calculated |
All figures are indicative and subject to exchange rates, freight-market conditions and contract specifics. Indian FOB reflects washed (not buffered) pith from Tamil Nadu. Brazilian FOB reflects Carve's export programme, FOB Pecem.
Assessment
Brazilian coir reaches Callao at near-parity: a 10–19 % premium over Indian coir on CIF terms. However, the premium is offset by:
21–31 fewer transit days, which reduce working-capital cost and allow just-in-time ordering.
Likely 0 % import duty under ACE 58, versus 0–6 % for Indian origin.
No Suez/Red Sea risk, which has added unpredictable delays and surcharges to Indian shipments since 2023.
Supply diversification, reducing dependence on a single-origin corridor through the Indian Ocean.
Substrate cost per hectare
| Metric | Range | Source |
|---|---|---|
| Initial substrate cost | US$ 6,000–11,000 /ha | Industry estimates |
| Substrate lifecycle | 4 years typical | Industry practice |
| Annualised cost | US$ 1,000–2,750 /ha/yr | Calculated |
| Blueberry revenue per ha | US$ 50,000–120,000 /ha/yr | ADEX, industry |
| Substrate as % of revenue | 0.8–2.3 % | Calculated |
Revenue per hectare varies widely with variety, yield, timing and market price. The 0.8-2.3 % range uses the blueberry-export-value approach: total export value divided by hectares in production.
07 · Frequently asked questions.
Why does Peru import so much coir substrate?
Peru is the world's largest blueberry exporter (US$ 2.27 billion in 2024-25), and blueberries require acidic growing conditions (pH 4.5–5.5) that Peru's alkaline coastal soils (pH 7.5–8.5) cannot provide. Soilless substrate cultivation in coir pots delivers yields of 20 t/ha versus 6–10 t/ha in soil, a 2–3x multiplier. About 80 % of new 2026 plantings are hydroponic, and 81 % of existing blueberry area has not yet converted to substrate, creating a large addressable market for coir pith.
How much coir does Peru import per year?
Volza shipment tracking records approximately 573 coir-related shipments to Peru as of September 2026, across categories including Coco Peat (364 shipments), Coir Pith (128), Coconut Fibre (74) and Coir Fibres (7). At 20–23 tonnes per container, this implies roughly 11,460–13,179 tonnes per year. Import growth was +69 % year on year in the March 2023 to February 2024 period. India supplies an estimated 85–90 % of this volume; Brazil currently supplies zero.
Which crops drive coir demand in Peru?
Blueberries are the dominant driver: 20,195 hectares of certified area, with 19 % already in substrate pots and 80 % of new plantings going hydroponic. Avocado nurseries use coir for rootstock propagation. Table grapes and asparagus in the Ica region add incremental demand. The same large agro-export companies typically grow all four crops, so procurement is bundled: a single buyer relationship covers multiple segments.
How long does it take to ship coir from Brazil to Peru?
A container from the Port of Pecem in Ceara, Brazil, reaches Callao (Lima) in 10–14 days, routing northward through the Panama Canal, approximately 6,000 nautical miles. By comparison, India to Callao takes 35–45 days, Sri Lanka 30–40 days and the Netherlands 20–28 days. Brazil's route avoids the Suez Canal and Red Sea, eliminating the geopolitical disruption risk that has affected Asian shipping since late 2023.
What quality does Peru's blueberry sector require?
Washed or buffered coir pith with EC below 0.5–1.0 mS/cm (1:5 extract), pH 5.5–6.5, moisture below 18 %, expansion of 13–16 litres per kg and low dust content. Buffered coir (EC < 0.5, calcium-nitrate treated) is preferred for hydroponic blueberry production because it displaces exchange-bound sodium and potassium. Consistency lot to lot matters more than any single test result.
Is Brazilian coir price-competitive with Indian coir in Peru?
Brazilian coir reaches Callao at near-parity: estimated CIF of US$ 678–730 per tonne versus ~US$ 615 for Indian washed pith, a 10–19 % premium. This is offset by 21–31 fewer transit days (lower inventory cost, faster response), likely 0 % import duty under the ACE 58 trade agreement (versus 0–6 % MFN for India), no Suez/Red Sea disruption risk, and supply-chain diversification. Substrate cost is 0.8–2.3 % of blueberry revenue per hectare, so a modest premium has negligible impact on farm profitability.
MARKET INTELLIGENCE BY REGION
Coir markets we cover
Sourced market data and import guides for the destinations we serve from Pecém, Brazil.
For the worldwide picture, see our Global Coir Market overview.
08 · Sources.
- ADEX / SUNAT, Peru blueberry export statistics, campaign years 2015-16 through 2024-25. Reported by Agraria.pe and industry sources. US$ 2.27 billion figure for 2024-25 campaign.
- ProArandanos / Sierra y Selva Exportadora, Peru blueberry production and export volume statistics, 2024-25. Volume ranges reflect differences between ADEX and MINAGRI reporting.
- Published agronomic literature on Peru's coastal desert soils: pH 7.5-8.5, high salinity, low organic matter. See also FAO Soils Portal, Peru country profile.
- Industry case studies on soil-to-substrate conversion yields in Peru blueberry production: 6-10 t/ha (soil) versus 20 t/ha (substrate pots). Reported by multiple agro-export companies at industry conferences, 2024-25.
- Industry reporting on Peru's hydroponic adoption rate for new blueberry plantings (~80 % in 2026) and existing substrate penetration (~19 % of certified area). ProArandanos and company disclosures.
- ProArandanos, certified blueberry area in Peru: 20,195 ha. Regional distribution across La Libertad, Ica, Lambayeque and Piura. Substrate area estimated at ~3,400 ha based on industry interviews.
- Substrate cost per hectare calculated from industry-quoted prices for 5 kg coco peat blocks, installation density of ~60-80 bags per hectare, and a 4-year replacement cycle. Revenue per hectare from ADEX export data divided by harvested area.
- Volza, Peru coir import tracking, scraped September 2026: ~573 shipments across Coco Peat (364), Coir Pith (128), Coconut Fibre (74) and Coir Fibres (7). YoY growth of +69 % for Mar 2023 to Feb 2024 period. Origin shares estimated from consignor data — volza.com.
- ADEX / SUNAT, Peru avocado export data, 2024-25. Peru ranks among the top-5 global avocado exporters by value.
- Climate data for Ica department: annual rainfall below 10 mm in the driest zones. SENAMHI (Peru national meteorological service) and FAO AQUASTAT.
- Olmos irrigation project, Lambayeque: 43,500 ha of new irrigable land. Gobierno Regional de Lambayeque / Odebrecht (now Novonor) project documentation; Agraria.pe reporting on blueberry expansion in Olmos.
- APM Terminals Pecem, shipping line schedules and published transit times. Pecem handled 706,509 TEU in 2025 (+27 % YoY). Transit Pecem to Callao estimated at 10-14 days via Panama Canal based on published schedules — apmterminals.com/en/pecem; Governo do Ceara / CIPP, 24 February 2026 — ceara.gov.br.
- ACE 58 (ALADI Economic Complementation Agreement 58) tariff schedules for Brazil-Peru trade. SUNAT / ALADI tariff preference lookup. MFN rates for HS 5305 and related headings per SUNAT customs tariff.